Measuring results the right way - Avoiding OKR pitfalls
-
Simone Rossi
- 24 Oct, 2024
- 02 Mins read

We have made a lot of effort to introduce OKRs (see the serie on 42), and everyone is excitedly filling in spreadsheets and setting lofty goals. The hype is real - after all, who doesn't like achieving big dreams?
But let’s pause for a moment. Measuring results is great, but it only works if the measures themselves make sense. Sometimes, numbers can mislead, and even well-intentioned measurements can take us down the wrong path.
I recently started reading a few books about cognitive psychology (I want to learn more about artificial intelligence, but first I need to understand the "natural" one!) and I discovered a research done by Daniel Kahneman on the behavior of Israeli Air Force pilots, trying to understand what influenced their performance. He observed something curious: after the instructor praised a pilot for a good maneuver, the pilot's next attempt was often worse. Conversely, when a pilot was scolded for a poor maneuver, their next attempt usually improved.
It might seem like shouting at pilots improves their performance, but Kahneman realized this was simply the effect of what is statistically known as "regression to the mean". Pilots performed better or worse at times, but eventually, their performance tended to move back to their average. The instructors weren't improving performance by yelling, they were just witnessing natural fluctuations. This example perfectly illustrates why we need to be cautious when interpreting results: we must make sure we're not misreading natural trends as causal relationships.
Now let's go back to our OKRs: measuring results is important, but understanding what drives those results is crucial. For instance, if your Key Results say you need to increase user engagement by 20%, it’s not enough to just look at engagement metrics at the end of the Sprint and pat yourself on the back if the number went up. You have to understand why it went up. Did it really go up because of your efforts, or was it influenced by factors outside your control,like a new trend on social media that coincidentally boosted user activity?
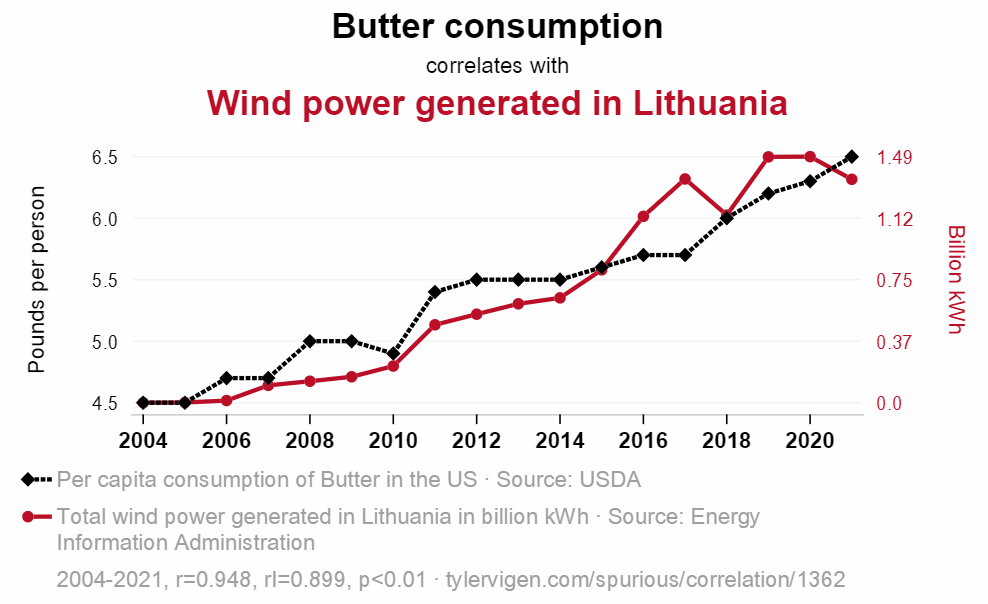
Just because two things happen at the same time doesn't mean one caused the other. Correlation does not mean causation, and assuming otherwise can lead to misguided decisions. If you want to have some fun and watch some spurious correlations (i.e. things that may seem correlated but are not), you may have a look at Tylevvigen.com where you will see a lot of charts that seems to be correlated (even with p < 0.01) but that do not relate at all, such as the following!

And of course, the cover image of this article is the AI generated explanation to explain it!
When working with OKRs, we need to be mindful of setting key results that are meaningful and carefully analyzing what's behind the metrics we use. Good OKRs don't just measure the end result, they ensure the measures align logically with our objectives and help us draw valid insights about our progress. Next time we are defining or reviewing our OKRs, take a moment to ask ourself: are these measures really telling the whole story?


