Netbackup data on Grafana with Prometheus
-
Miso Mijatovic
- 11 Sep, 2020
- 03 Mins read
A new challenge
In Sorint Spain we have many colleagues working with Netbackup from Veritas. Although our colleagues are very good and expert, it may be sometimes difficult to easily extract some information from the solution, especially when speaking about derived information, by this a mean ratios, trends and so on.
This is the case of a ratio that our customer needs to present to their management, they want to be represented in real time the ratio of successful jobs per type, over the total. Not only, this customer is also offering backup as a service and would like to see this data for each of their clients.
Here I explain how we approached this challenge with a complete and extensible solution.
Our solution
To get the information needed we decided to leverage the API of Netbackup. This is very complete and covers almost all the things you can do with the solution. We could not find an API client library for python, out choice language, so we decided to write our own.
To collect the information we decided to use the open source solution Prometheus. This is a monitoring solution that works with a pull mechanism: contrary to the majority that waits for the data to be sent, this solution crawls the data from the monitored target. To do this, the target needs to expose the metrics via HTTP, if this is not natively done, the solution is to use an exporter. Netbackup does not have an exporter, so we wrote our own on top of our python module.
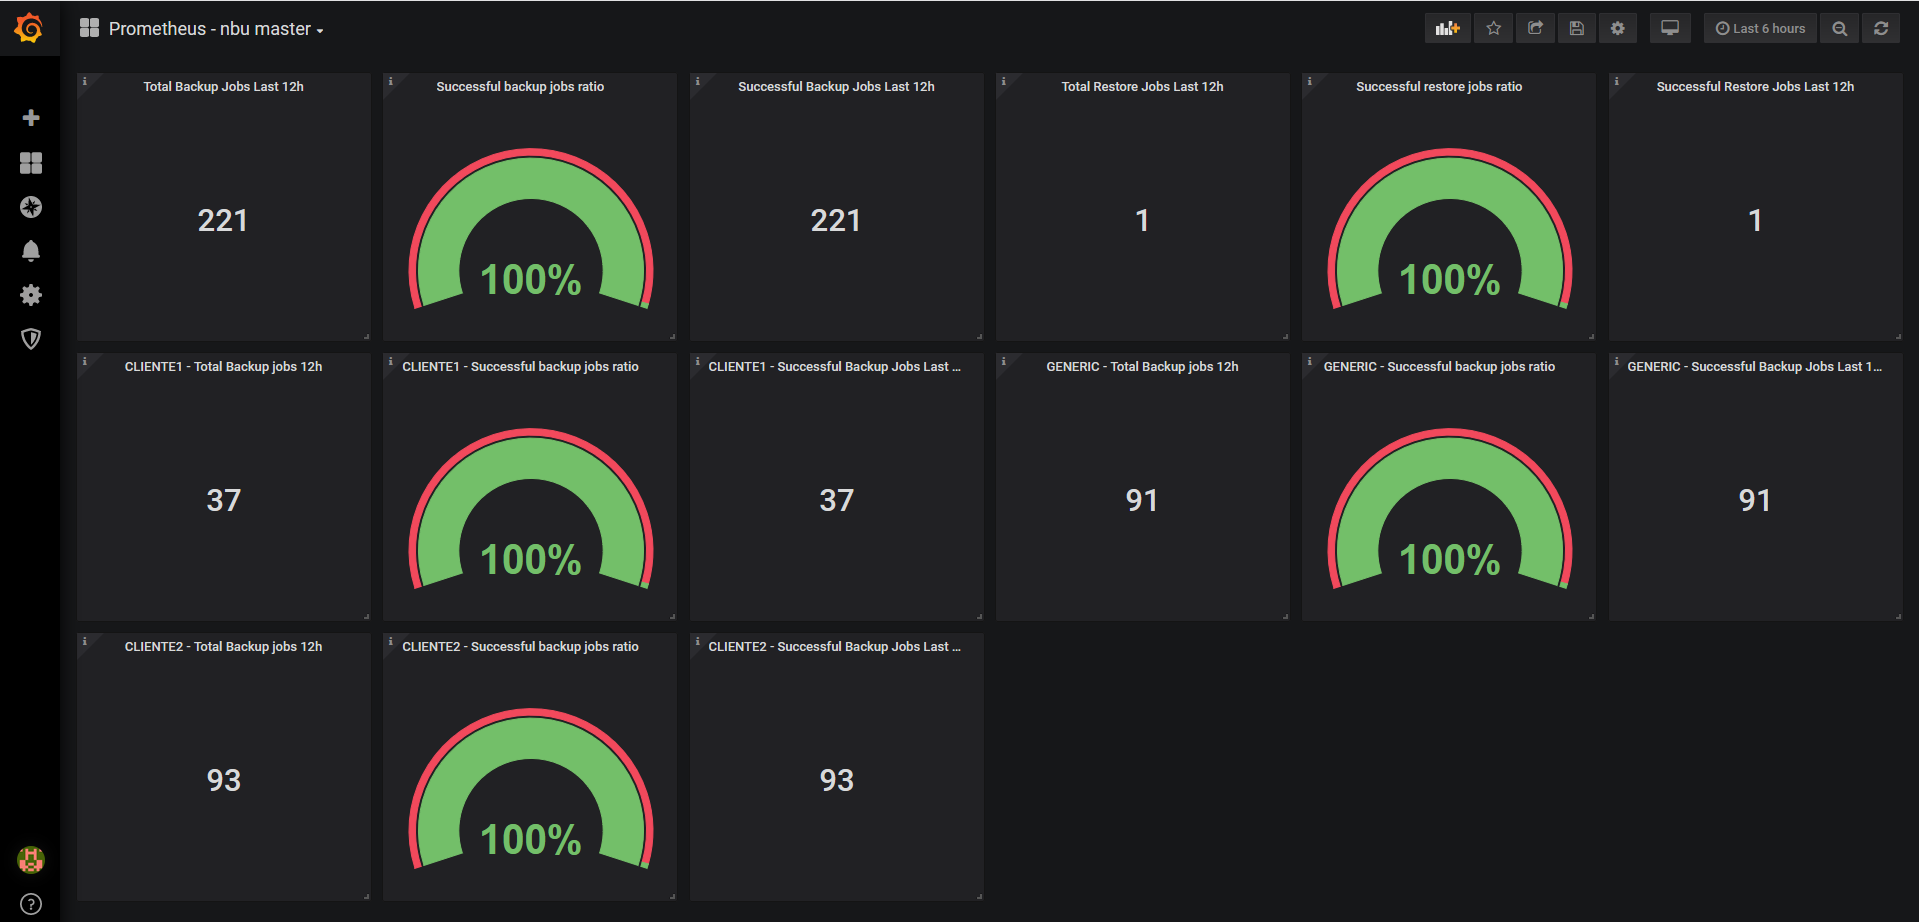
The exporter is nothing more than an HTTP server collecting and publishing some metrics following the Prometheus standard. Our customer adds to every backup policy name a code to distinct their customers, here in the exporter we automatically get this data and create different metrics for each one of them. Now we are able to configure Prometheus to crawl and collect our jobs data, this information is searchable, but Prometheus is not the correct solution for a simple visualization of this data. For this we decided to use Grafana, which integrates natively with Prometheus and permits us to calculate and visualiza the ratios:
Technical details
As said we wrote our own API client for Python, this is very easy and follows the organizations of the Netbackup API. In fact, the latter organizes its API in groups, every group refers to an URI path and manages certain aspects of the platform. For example the Authorization group refers to the /auth/ path and manages the login/logout and the non login methods, the Administation group refers to the /admin/ path and manages everything around the backup jobs, and so on.
Following this schema, we created a class for every group, the most important being the NbuAuthorizationApi that implements the underlying methods to communicate to the API plus the authorizaiton API calls. Then there is a class for every other group, with the difference that these inherit all the methods from the NbuAuthorizationApi. In this way the NbuAdministrationApi has the login/logout and communication methods, plus implements all the methods to retrieve the information on the backup jobs. There is also a generic NbuApiConnector which inherits all the methods from all the classes.
Here we show the creation of the object and the retrival of the backup jobs:
nbu = NbuAdministratorApi('https://{}:{}/netbackup/'.format(args.nb_hostname, args.nb_port), '', '', verify=args.verify_https)
nbu.set_api_key(args.api_key)
hours_12_ago = (datetime.datetime.utcnow() - datetime.timedelta(hours=12)).strftime('%Y-%m-%dT%H:%M:%S.000Z')
odata_filters = "jobType eq 'BACKUP' and endTime gt {}".format(hours_12_ago)
backup_jobs = nbu.get_jobs(filters=odata_filters)['data']
Leveraging our module we created the Prometheus exporter. Prometheus provides a python module that helps you to build the objects containg the metrics following its standards. In the exporter we create a simple gauge object as nbu_jobs_info, in this object we collect the jobs metrics, each one of them described by a label that is exposed with it.
Here we can see the creation of the Gauge object with the Prometheus module and the exposition of a metric:
NBU_JOBS_INFO = prometheus_client.Gauge('nbu_jobs_info', 'NetBackup jobs information', ['resource_type'])
NBU_JOBS_INFO.labels('TotalBackupJobsLast12h').set(len(backup_jobs))
I will not dwell on the Prometheus and Grafana configurations, which are standard.
Expandability
The project can grow and change in many ways.
We still haven't implemented all the API methods in the python client library, this is because they're MANY and they're out of the scope of this project. But they're still there, and thanks to the way we wrote the library, they're easy to add.
This library then can be obviously used for other scopes than the Promethus exporter, for example as base for the Ansible module we're preparing to automatize the configuration of Netbackup ;)
Last the exporter, so far it expose only some data about the jobs, but having access to the needed information, it can be modified to expose more data.
Conclusion
Here's how we decided to face the challenge, creating an easy replicable solution, where the components are generic and can be used for other purposes, while being extremely effective for our goal. This is also thanks to the great knowledge shared with me by all the Sorint Spain team.
For any additional information, don't hesitate to contact me!