Netbackup Opscenter Issues
-
Pablo Panos
- 12 Apr, 2019
- 04 Mins read

INTRODUCTION
I am writing this post as if a "post mortem" report after I was involved in the investigation of an incident where a Netbackup Opscenter running on a VMware virtual machine hit 100% CPU usage during the report generation process causing that reports were suffering several hours of delay.
What you will find in this post is the process we followed in order to identify and fix this issue, the modifications we made to the original environment configuration and lessons learned during this incident.
Even if I'm writing this post, the work done in order to fix this issue has been carried out for several people so this is not a one person work.
BACKGROUND
Netbackup Opscenter is the monitoring and reporting tool for Veritas Netbackup environments, it is usally installed on a virtual machine and some customers use this tool to do charge back to their customer, business units, internal departments, etc... .
Netbackup opscenter tool collects data form one/various Netbackup Master Servers saving it onto a Sybase data base. Customers can schedule report generation using built-in, custom reports ones based on several templates or running SQL queries on the DB and then export results to a different formats (pdf,csv,tsv,..) save to a disk and/or send them by email.
ISSUE
The issue came up days after a hardware refresh and Opscenter version upgrade, just when high load on the server was expected. Customers reports delivery/generation were suffering high delays, this behaviour was not observed in the old Opscenter server/version.
Inside Virtual Machine
No bottlenecks were observed in the Opscenter Virtual Machine but CPU contention, see image: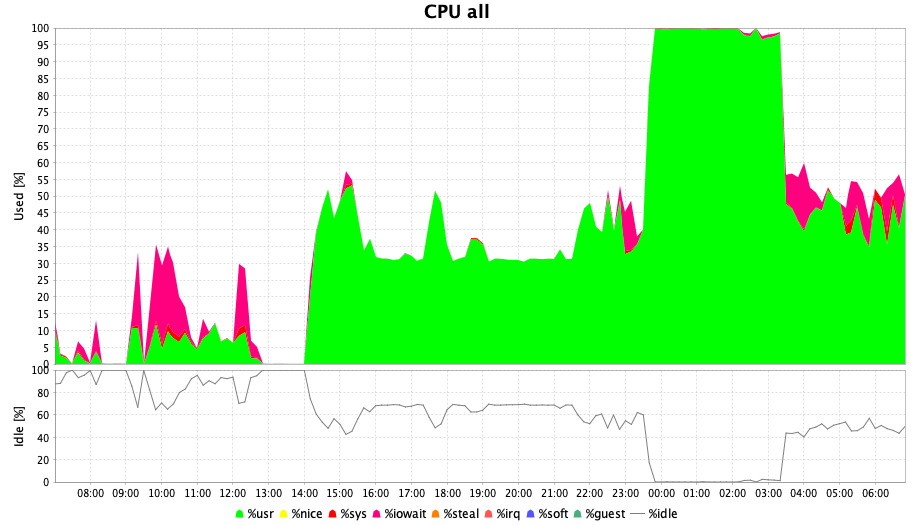
Outside Virtual Machine
There was something wrong, ESXi CPU said just 50% was used
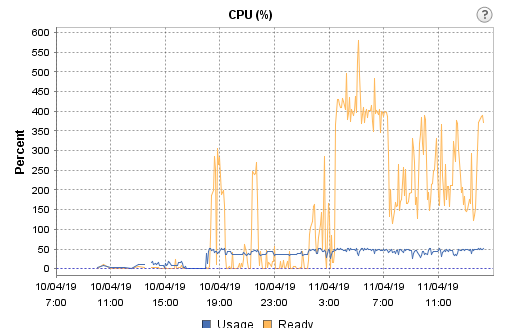
Looking for the "Ready" (orange line) meaning, we found :
vCPU Ready Time vCPU ready time is the percentage of time a VM was ready but could not get a physical CPU to run on.
One of the common causes for high vCPU ready time is over-subscription. If a VM is allocated more vCPUs than the physical CPUs (pCPUs) that are available on the host, then, during times of heavy load, when ideally, all vCPUs have to run full time, many vCPUs may not run for want of pCPUs. The result: The VM and applications running on it will run short of processing power, which, in turn, will degrade VM performance. Therefore, it is important to track the vCPU ready time of each VM. If this metric is over 5% for a VM, it indicates that the VM is slow. You can correlate this metric with the host’s CPU usage to figure out if there was a contention for physical CPU resources around the same time the vCPU ready time spiked. If so, you can conclude that the VM is over-subscribing to the host’s CPU resources. For corroboration, you can also monitor the number of pCPUs available to the host and the count of vCPUs allocated to each VM. This will point you to oversized VMs and prompt you to resize such VMs, so that vCPU ready time can be minimized. The recommended vCPU to pCPU ratio is between 1:1 and 3:1.
So, in order to confirm we were in the situation of "over-subscription", we decided to go for a 1:1 ratio and reduce the number of vCPU from 16 x 1 core to 4 x 1 core each, and this was the result:
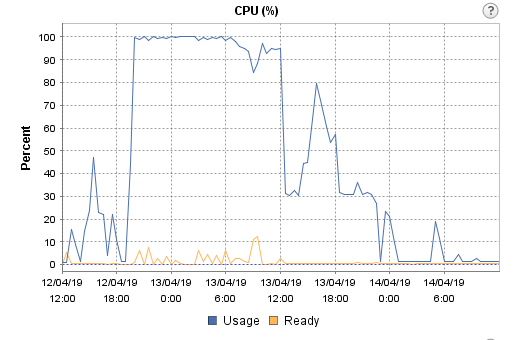
Even though a flat 100% CPU use line is shown in the graph, reports were generated and delivered as expected.
INCIDENT
Summary
- Reports were being generated with several hours of the delay due to a CPU contention on the ESXi host where the Opscenter Server was running
Impact
- Customers were not receiving the information about status of backups , capacity consumed, etc.
Root cause
Misconfiguration of the vCPUs of the vmware virtual machine where the Opscenter Server was running
Trigger
Latent CPU contention triggered by combination of exceptionally high load and CPU contention when all possible report schedules run on the same day.
Detection
- Backup administrators realized that reports were not being generated as expected.
- Load Tests on a cloned VM runing on the same ESXi hosts and DataStore
- VMware CPU Ready of the virtual machine metric shows values up to 400%
Action
- Modification of the VMware Virtual machine setting so that the number of virtual CPUs follow the rule of 1:1 - 3:1( vCPu:pCPU)
Note: vCPU stands for Virtual CPU and pCPU stands for physical CPU
Note: I'm using Google's SRE postmortem format
Lessons Learned
We could summarize all we have learned as follows:
- Monitor everything before the failure. You'll have some metrics to compare to your tests results.
- Try to build the more similar test environments to the production one.
- Look at outside of the piece its failing. In our case, the issue was not within the VM but virtual infrastructure.
- Whenever you have to install a Veritas Netbackup product on a virtualization infrastructure, make sure VMs are configured following the best practices, not only coming from Veritas, but also from Virtualization vendor.