Performance and Tuning: The Scientific Methodology Applied to Indexing Strategies in MongoDB
-
Danilo Pala
- 22 Feb, 2024
- 05 Mins read

Today I’m going to talk about a methodology to help you to define indexes that fit the query, I’ll also explain and demonstrate why you should review the execution plans during the time. This article has as target those colleagues that are not familiar with performance and tuning tasks.
Probably you have heard the phrase: “tuning is an art”, but let’s demystify it. The first thing you should know is that in the MongoDB Documentation you can find a page dedicated to indexing strategies, where you can see a serie of recommendations (link in the references).
So, imagine a real world scenario, where you have identified a query in the log and contacted the application team to optimize that statement, and they ask you to help then to do it. A bit more of context, my team is of infrastructure DBAs, and we are not allowed to read the date in production environment.
First tip for my colleagues, don't take the responsibility for the optimization! At this point you may think, why are you writing this article if you won't take the responsibility? That’s the point, the variation of the data set can affect the efficiency of the index, and I’m going to show it. To be able to choose an index that “best” fit the query you have to know statistics about the value of each filtering/sorting field in the query.
Ok, let’s dive into the case, an aggregate with match, sort and group stages in the pipeline. In the match stage there are 2 fields in equality (the first one is a single equality, ex. eqFieldOne: “one”, the second one is passed in an array of values, ex. eqFieldTwo: [“a”,”b”]) and a range of time (classical interval of dates, ex. "timestampField": { "$gte": firstDate.getTime(), "$lte": lastDate.getTime() }). In the sort stage there is a another different field, ex. sortField: 1. Finally in the group stage there are other fields.
Well, if you have studied the Mongodb Documentation, MongoDB University and so on, you may think: the Equality, Sort and Range indexing strategy may fit the query. But let’s check it before suggesting an index.
Second tip, in my humble opinion, the scientific methodology is the best way to identify an index to fit a query, and, of course, it’s valid only for the data set that you have examined. For this case, I created 7 indexes and tested each one in a battery of tests:
db.getCollection("collTestESR").createIndex({"timestampField": 1 }, {"name": "timestampField"})
db.getCollection("collTestESR").createIndex({"eqFieldOne":1, "eqFieldTwo":1, "sortField": 1, "timestampField": 1}, {"name": "ESR"})
db.getCollection("collTestESR").createIndex({"eqFieldTwo":1, "eqFieldOne":1, "sortField": 1, "timestampField": 1}, {"name": "ESR2"})
db.getCollection("collTestESR").createIndex({"eqFieldOne":1, "eqFieldTwo":1, "timestampField": 1 }, {"name": "ER"})
db.getCollection("collTestESR").createIndex({"eqFieldTwo":1, "eqFieldOne":1, "timestampField": 1 }, {"name": "ER2"})
db.getCollection("collTestESR").createIndex({"timestampField": 1, "eqFieldOne":1, "eqFieldTwo":1  }, {"name": "RE"})
db.getCollection("collTestESR").createIndex({"timestampField": 1, "eqFieldTwo":1, "eqFieldOne":1  }, {"name": "RE2"})
Third tip, the version, I patched my laboratory to the same release (major and minor) of the production environment, It’s very important because MongoDB is constantly delivering new features to improve performance, and It may result in different execution plans, as well affect the result of tests.
Before starting the battery of tests, I had to investigate statistics about the values of each field: eqFieldOne, eqFieldTwo, sortField and timestampField. It can be done by querying a secondary/analytical node or in a interview with the application team (owner) of the database.
As result of this investigation about the variation of values for each field would be:
- eqFieldOne: 2 possibles values, and the most part would be matched by the query.
- eqFieldTwo: about 20 different values, and the match could variate between 10 and 90%.
- timestampField has a lot of values, as expected.
- sortField: could variate, it's unpredictable.
Then, I got a typical document that the query would match in Test environment, I masked any sensible data, of course, and load into my laboratory database by changing the values of each field, in this way the data set loaded should be similar to the production environment.
By the end of the data load, I had inserted between 48k and 180k documents per day, performing a total of 2.9M documents and size of 3.4GB. It’s about 1% of the size of the original collection.
It’s interesting to share the size the indexes:
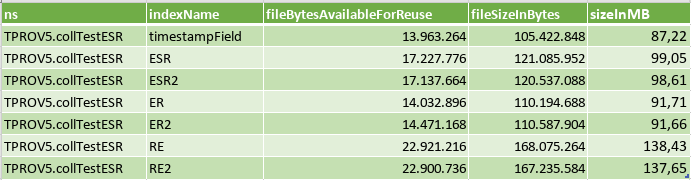
For the Battery of tests, I created a simple function that call the aggregate a few times, save the results in an array and export it to a file, which one I used the analysis that I’m going to share.
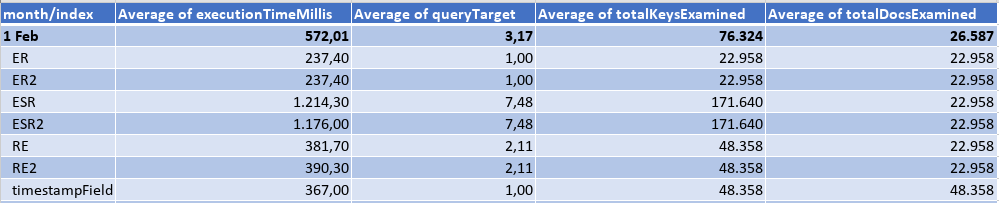
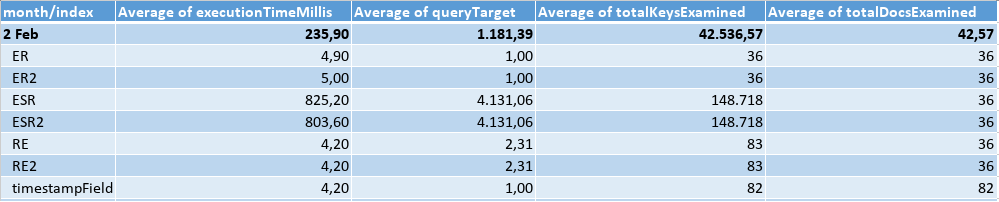
First month: the data load in February was as the following table, where the eqFieldOne would be matched by the query in 95% of the cases, and the eqFieldTwo 50%. There was 200 different values of the sortField and a lot of timestamp values.

Querying an interval of a whole day, I got the results:
Querying an interval of 5 min, I got the results:
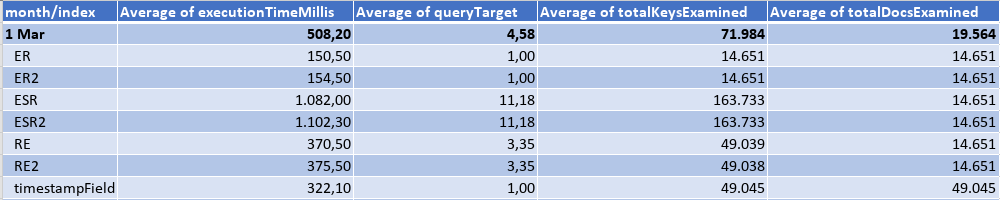
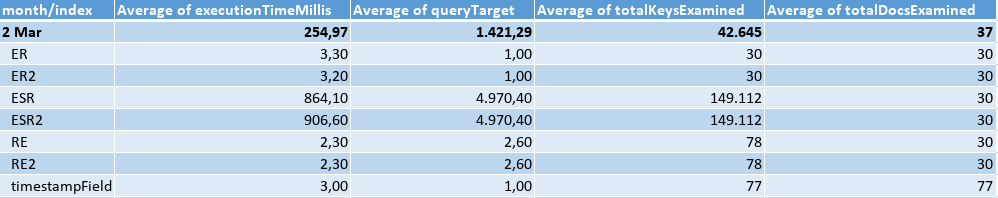
Second Month: the data load in March was as the following table, where the eqFieldOne would be matched by the query in 90% of the cases, and the eqFieldTwo 33%. There was only 20 different values for the sortField and a lot of timestamp values.

Querying an interval of a whole day, I got the results:
Querying an interval of 5 min, I got the results:
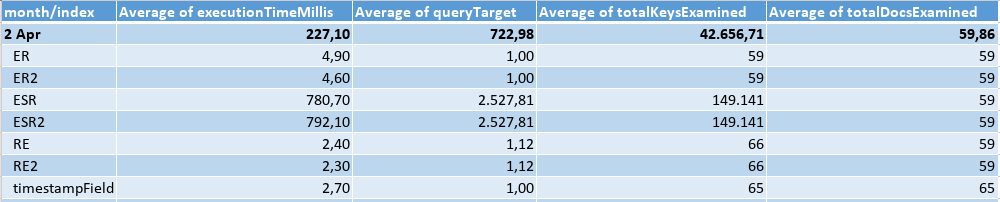
Third Month: the data load in April was as the following table, where the eqFieldOne would be matched by the query in 90% of the cases, and the eqFieldTwo 100%. There was only 2 different values for the sortField, and a lot of different timestamps.

Querying an interval of a whole day, I got the results:
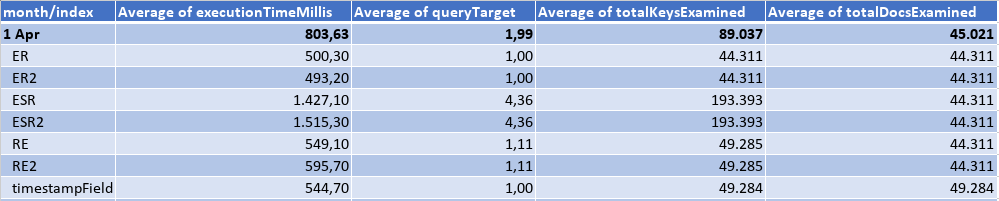
Querying an interval of 5 min, I got the results:
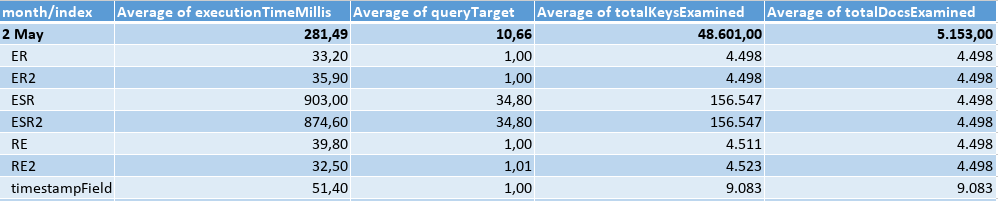
Forth Month: the data load in May was as the following table, where the eqFieldOne would be matched by the query in 50% of the cases, and the eqFieldTwo 100%. There was a lot of different values for the sortField, and just 288 different timestamps.

Querying an interval of a whole day, I got the results:
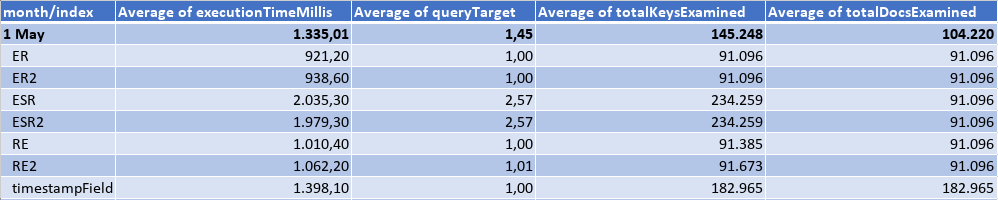
Querying an interval of 5 min, I got the results:
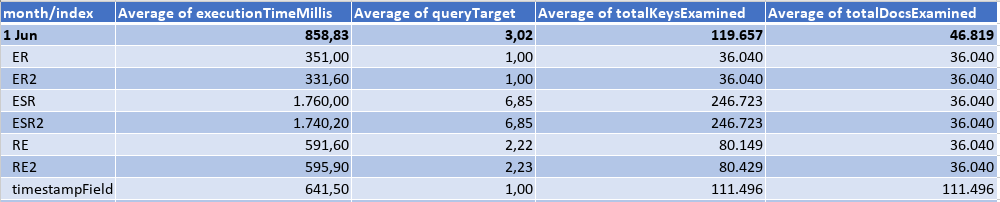
Fifth Month: the data load in June was as the following table, where the eqFieldOne would be matched by the query in 50% of the cases, and the eqFieldTwo 100%. There was a lot of different values for the sortField, and just 288 different timestamps.

Querying an interval of a whole day, I got the results:
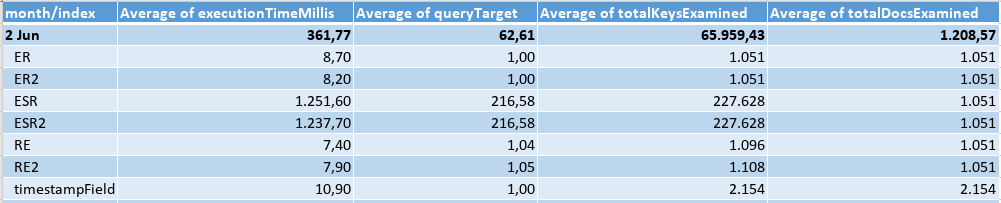
Querying an interval of 5 min, I got the results:
As a conclusion, some indexes have perform better than others based on the variation of each proposed data set. If you are looking for the “best” index to fit the query, there is no shortcut, you should apply the scientific methodology, by proposing indexes, testing each one and analyzing the results to be able to choose one to fit the data at the moment. Having tested different data sets is useful to show that if your data change during the time, you should review your indexes periodically. It should also be important to understand the differences between the execution plans of each index in each scenario, but I didn’t share the plans in this article because it’s vastly documented by MongoDB. By reading this article, I expect that you be careful when making suggestions without knowing the data. Finally, but not surprisingly, the ESR indexes had the longest execution time compared with all other indexes in any tested scenario.
Reference: https://www.mongodb.com/docs/manual/applications/indexes/


 stefano consonni
 Roberto Barbarito
  Giovanni Maria
 Leonardo Ludovico Ponnamperumage
  Juri Saleppico