Use case: How much a covered query can improve performance and the turn the metrics healthy in a Replica Set MongoDB?
-
Danilo Pala
- 12 Feb, 2024
- 02 Mins read

I’ve to say, it was quite difficult to convince the application team to create this index, but the results were awesome and because of that I decided to share them.
The scenario was a Replica Set where the tickets went down and queues rises frequently at the peak time. Dive into the log we got an aggregate with average time over 800ms, repeated about 200 times per second. Here you are an example (of course I masked any sensible data):
{"t":{"$date":"2024-02-01T11:07:30.473+01:00"},"s":"I", "c":"COMMAND", "id":0000, "ctx":"conn9999999","msg":"Slow query","attr":{"type":"command","ns":"DBNAME.collectionA","command":{"aggregate":"collectionA","pipeline":[{"$match":{"fieldOne":"999999","fieldTwo":"11111"}},{"$group":{"id":{"$fieldThree":"$fieldThree"},"status":{"$push":{"$cond":[{"$or":[{"$eq":["$fieldFour","STATUS_ONE"]},{"$eq":["$fieldFour","STATUS_TWO"]}]},"$$REMOVE","$fieldFour"]}}}},{"$match":{"status":{"$size":0}}}],"cursor":{},"allowDiskUse":false,"$db":"DBNAME",...,"planSummary":"IXSCAN { fieldTwo: 1, fieldOne: 1, fieldThree: 1 }","cursorid":,"keysExamined":4361,"docsExamined":4361,"numYields":1795,"nreturned":101,..."storage":{"data":{"bytesRead":209218360,"timeReadingMicros":30341496}},"remote":"...:***","protocol":"op_msg","durationMillis":41243}}
As you can see in the match stage there is an equality with two fields {"$match":{"fieldOne":"999999","fieldTwo":"11111"}} and both of then were covered by the index "planSummary":"IXSCAN { “fieldTwo”: 1, “fieldOne”: 1, “fieldThree”: 1 }". Another important evidence in this log is that the most part of the total execution time was spent reading from storage, it took more than 30 seconds. For the application team the query was already indexed, and at "stress test sessions" the result for that function was positive, so they wasn’t convinced to optimize it, they didn’t want to change the shape of the aggregate to avoid the validation path, it would take effort and time ($$$).
In some aspects the application team had reason, the query was indexed, the query targeting was 1:1 (before the group stage), but when the amount of data grows even those queries that at the beginning where performing pretty good may have to be reviewed. If the query is one of the most frequently executed, we have, at least, to try to optimize it as most as possible. It can be called 80/20 rule, or what ever you prefer, the fact was the execution plan of the query could be optimized, and we knew it.
Assuming that the application team couldn’t change the query shape, the proposed solution was very well knowledge (and documented): create an index to cover the query, in this way the query is solved only by the index, without fetching the documents from the collection. We have been proposing covered indexes a plenty of times. The proposed index was:** { “fieldOne”: 1, “fieldTwo”: 1, “fieldThree”: 1, “fieldFour”: 1 }**. You may note that proposed index has changed the order of the first and second field, it was chosen based on the data distribution, the fieldOne is more selective than the fieldTwo.
So after more than 450 days since the first email, we got a deal with the application team and the index was created, this is the result:
Cache Activity: drops for 10% of the value before the index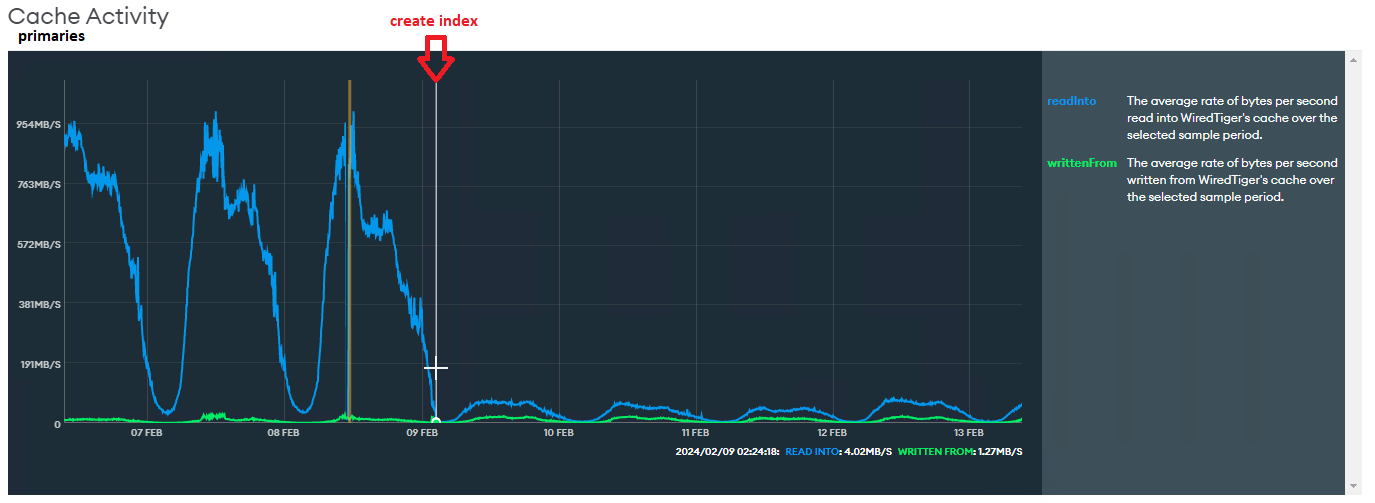
Process CPU: about 40% lower than before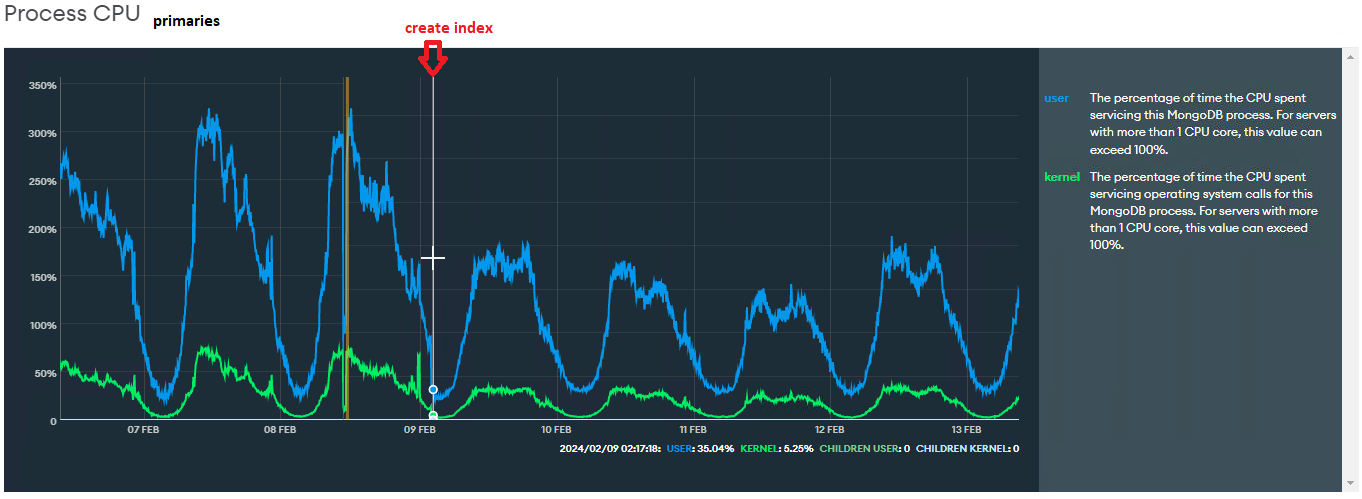
Tickets Available: more stable after the new index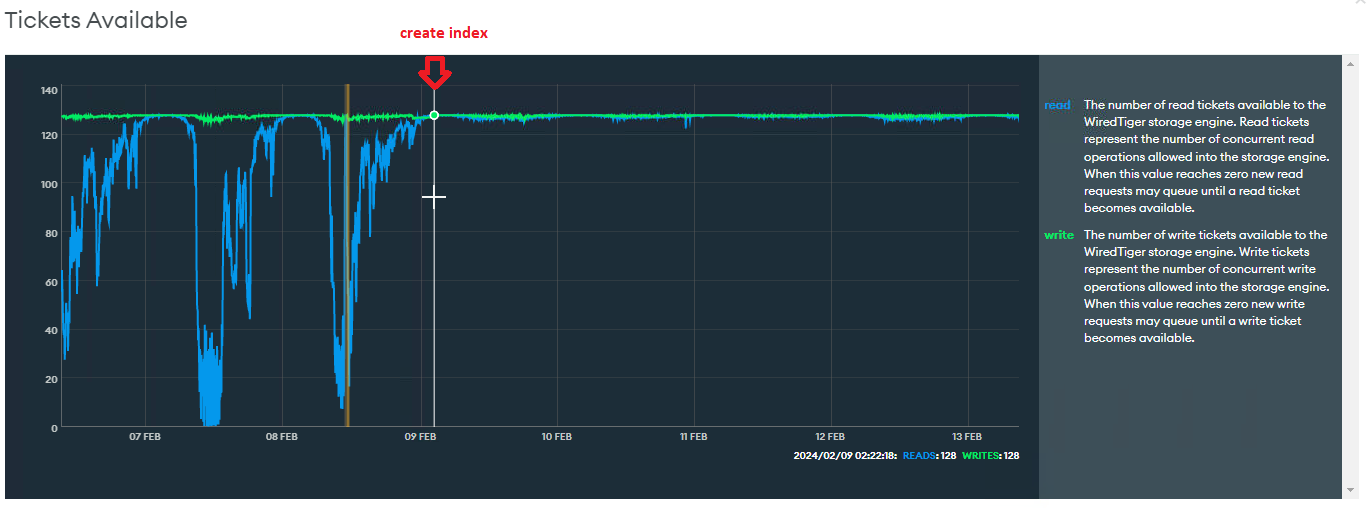
Queues: has dropped drastically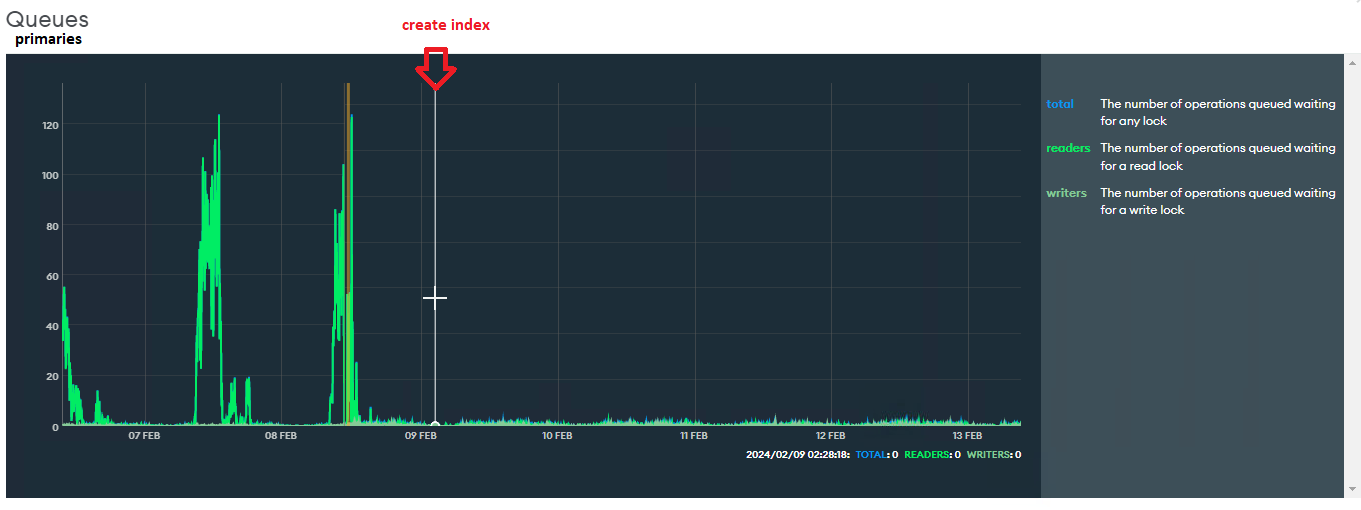
Query Targeting: the number of documents scanned/returned has dropped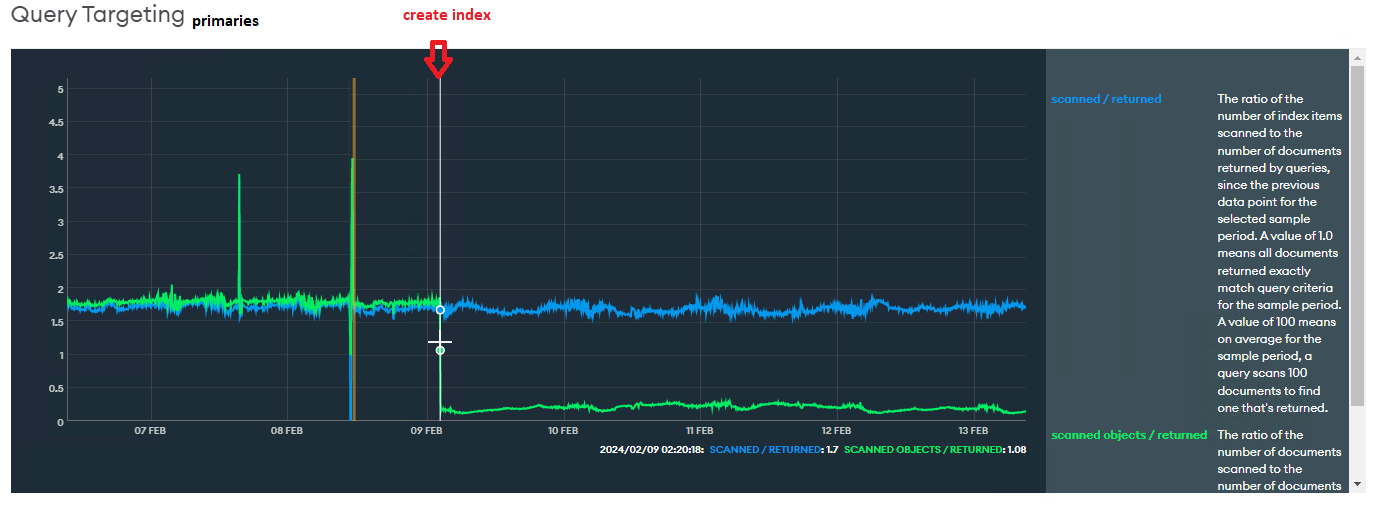
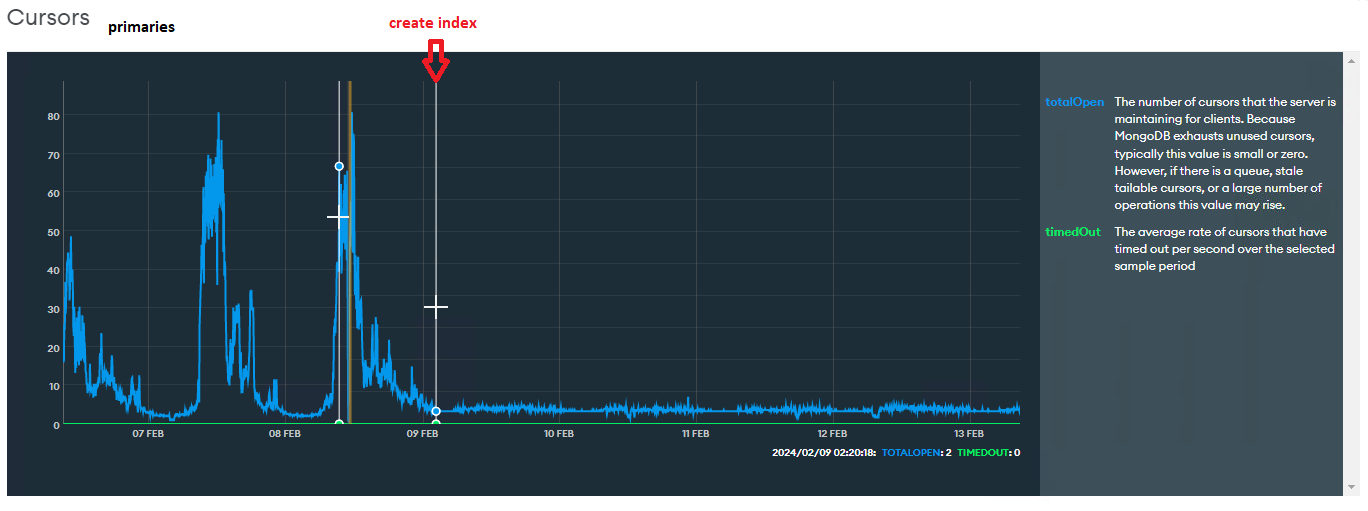
Cursors: number of open cursos has decreased
Opcounters: similar workload
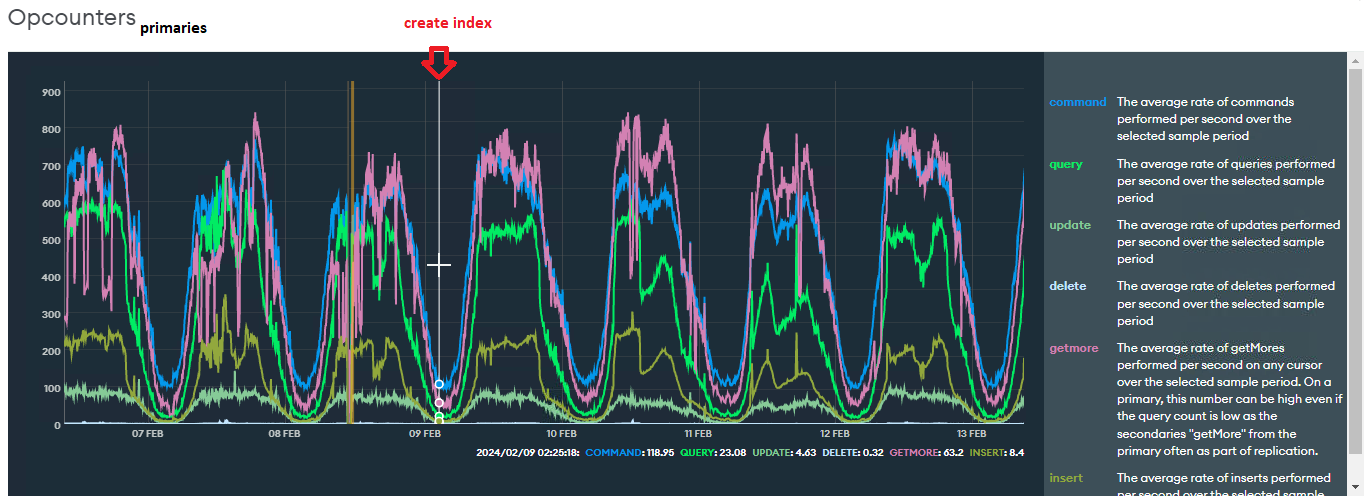
*We switched the primary, so I consolidated manually the graphics of the primaries to help the visualization
At the log we hasn’t found that aggregate anymore, this indicates that the query was executes in less than 100ms.
In the end, after creating the index the metrics have turned healthy, the execution time of the query has dropped drastically, and we save the nodes of a vertical scale. Tuning activities may be a challenge, but I’m personally satisfied with the result of this one.
Reference: https://www.mongodb.com/docs/manual/core/query-optimization/#covered-query


 stefano consonni
 Roberto Barbarito
  Giovanni Maria
 Leonardo Ludovico Ponnamperumage
  Juri Saleppico