Nornal flowcharts and BPMN charts
-
Simone Rossi
- 08 Nov, 2023
- 02 Mins read
I have already written in some articles that I like to use flowcharts to understand and explain some concepts, like my first work for Hackersgen or what I recently did for the POC of the ISA project.
Yes I like to use images and shapes to transforms abstract concepts into tangible representations, making the complexity of tasks and interactions comprehensible to stakeholders at every level. In this article, I will explore two powerful tools in the realm of process visualization: normal flowcharts and BPMN charts (Business Process Model and Notation), and shed light on how they contribute to the art of explaining business workflows.
Normal flowcharts
Normal flowcharts provide a straightforward and easily understandable representation of processes.
- Symbols and Shapes: normal flowcharts utilize distinct symbols and shapes to represent different elements of a process. The commonly used rectangles denote processes, diamonds signify decision points, and ovals mark the start or end of the journey.
- Linear Structure: they follow a more or less linear structure, that suits processes with minimal decision points. They guide the stakeholders through a step-by-step journey without unnecessary complexity.
- Universal Language: flowcharts offer a universal language for conveying processes, and their simplicity ensures that team members across diverse roles and departments can easily interpret and follow the visual narrative.
In essence, flowcharts transform the complexity of business processes into a visual flow, fostering understanding and collaboration among team members.
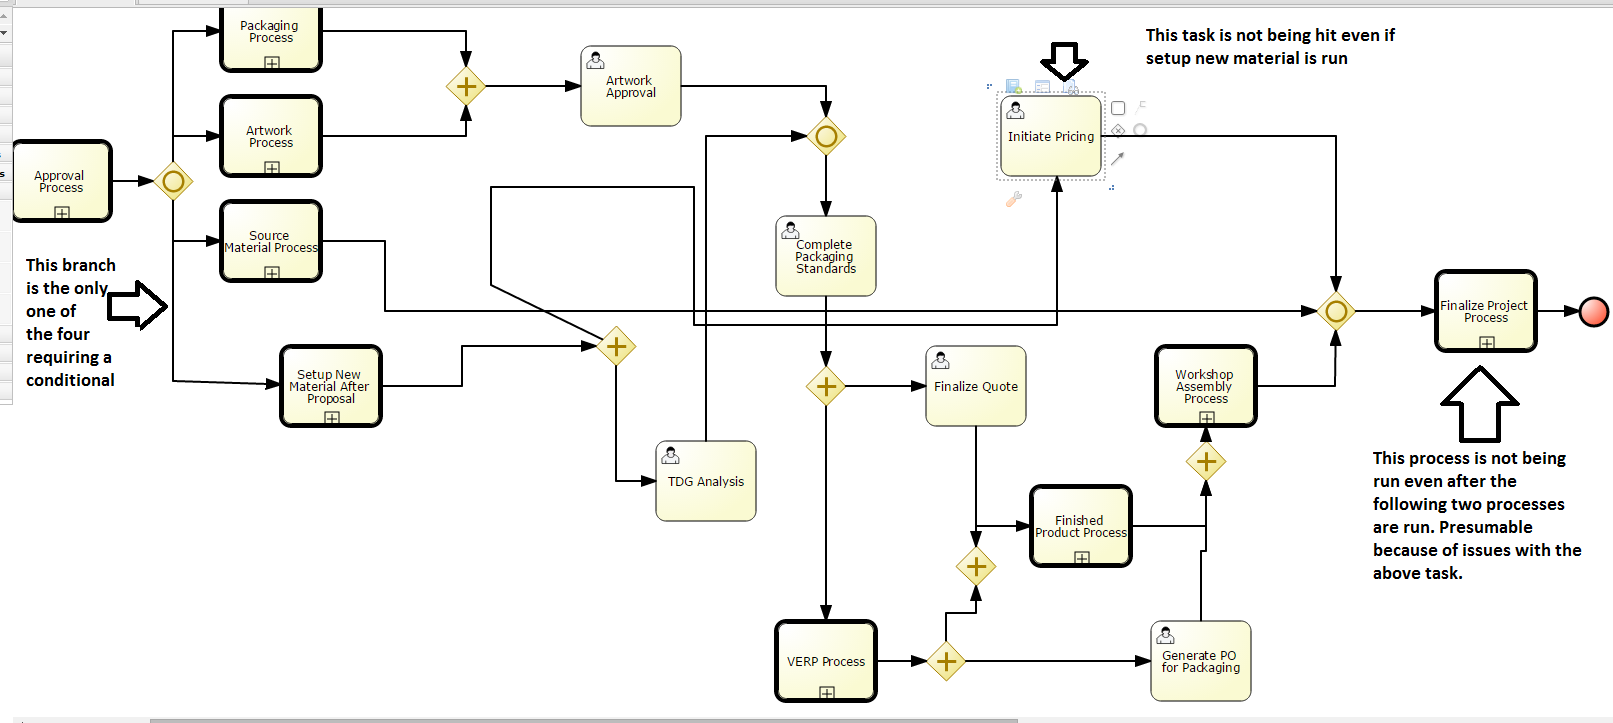
BPMN charts
BPMN charts add a layer of richness and expressiveness to the narrative of business processes, introducing a more sophisticated and detailed approach to process visualization. BPMN nature allows for a detailed depiction of activities, gateways, events, and their dynamic interactions.
Now the BPMN is in its version 2.0 (you can find it on the official website), however the specification is not that easy to read and apply, I suggest to take an online course :)
- Rich Symbol Set: unlike the simplicity of normal flowcharts, BPMN charts have a universe of symbols. Activities, gateways, events, and connecting objects... Each symbol offers a level of detail that is particularly beneficial for representing complex and dynamic workflows
- Dynamic Interactions: BPMN charts depict the dynamic interactions and decision points within a process, such as strategic decision or a significant event, allowing stakeholders to understand the key points
- Data analytics capabilities: Analytics tools can be integrated with BPMN charts to gather insights into process performance. This data-driven approach enables organizations to identify bottlenecks, optimize workflows, and continuously improve efficiency
- Automation capabilities: Automation engines can interpret the visual language of BPMN and execute processes autonomously
Conclusion
In the realm of process visualization, normal flowcharts and BPMN charts are your trusty guides, each with a unique role to play. Whether you opt for the simplicity of a traditional flowchart or dive into the expressive world of BPMN charts depends on the intricacies of your business processes.


 Marina Salvati